
Motion Design: Roblox Animated Infographic
This Project Uses: Microsoft Excel. Adobe AfterEffects, Adobe Illustrator
In this animated project, I wanted to gather data that I found about the popular game Roblox.
Roblox is a free-to-play game with a large community ranging from children to young adults. After a surge of new users learning more about the game through TikTok, this children-friendly game has seen a spike in mature audiences.
This project includes:
Logo Lockup Creation & Ideation
Multimedia Graphics & Icons
Final Poster & Animated Video
Gathering Data
I started tracking how much I’m playing Roblox. I wanted to see how my daily time on the gamy averages out each week and how much of that time is spent with friends. With the platform hosting thousands of games, I also wanted to keep track of what certain games and genres take up the most of my experience. Some baseline statistics I’m looking for are:
How long I’m playing and comparing it to user averages.
What I’m playing, what games/genres are taking up most of my engagement.
When I’m playing alone and when I’m playing with friends.
Graphs/statistics of user growth and the age range of users (Provided by Backlinko)
Sketching & Brainstorming
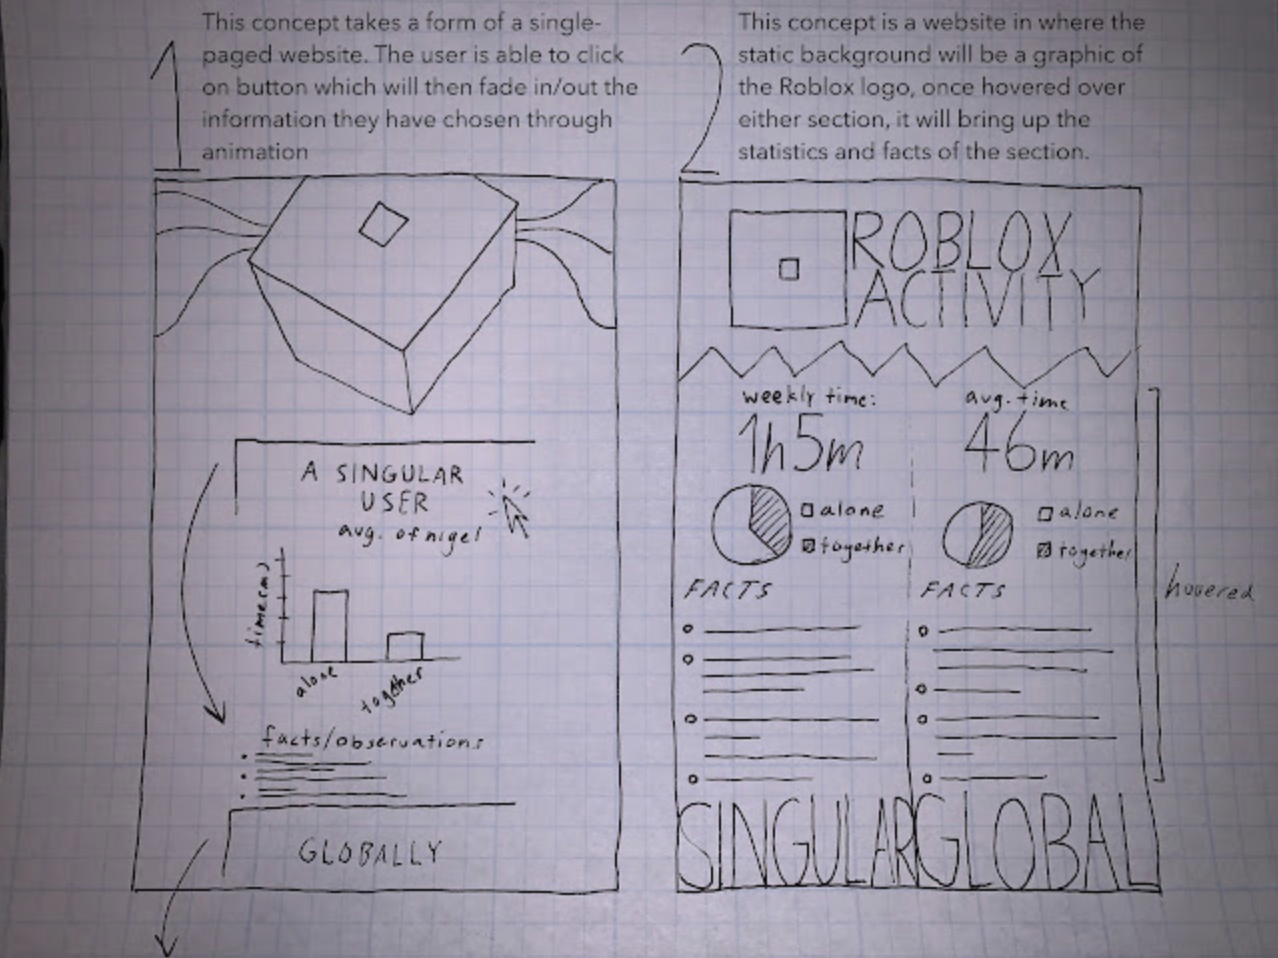
After looking through the briefs, I was able to think of some ideas to make my infographic come to life. The sketches for this project take on a multitude of different formats and medias. These include:
Sketch 01:
This concept takes a form of an animated GIF. The user is able to view statistics that fade in/out of textual analytics and informational graphics.
Sketch 02:
This concept is a website in where the static background will be a graphic of the Roblox logo, once hovered over either section, it will bring up the statistics and facts of the section.
Sketch 03:
This concept can be seen as both an animation or a webpage.
If this were to be a webpage, the user can click through assorted information that has been sorted through time periods.
If this were to go the animation route, each column will be displayed one at a time along with accompanying motion graphics in the other spaces.
Going Digital & Assembling Data
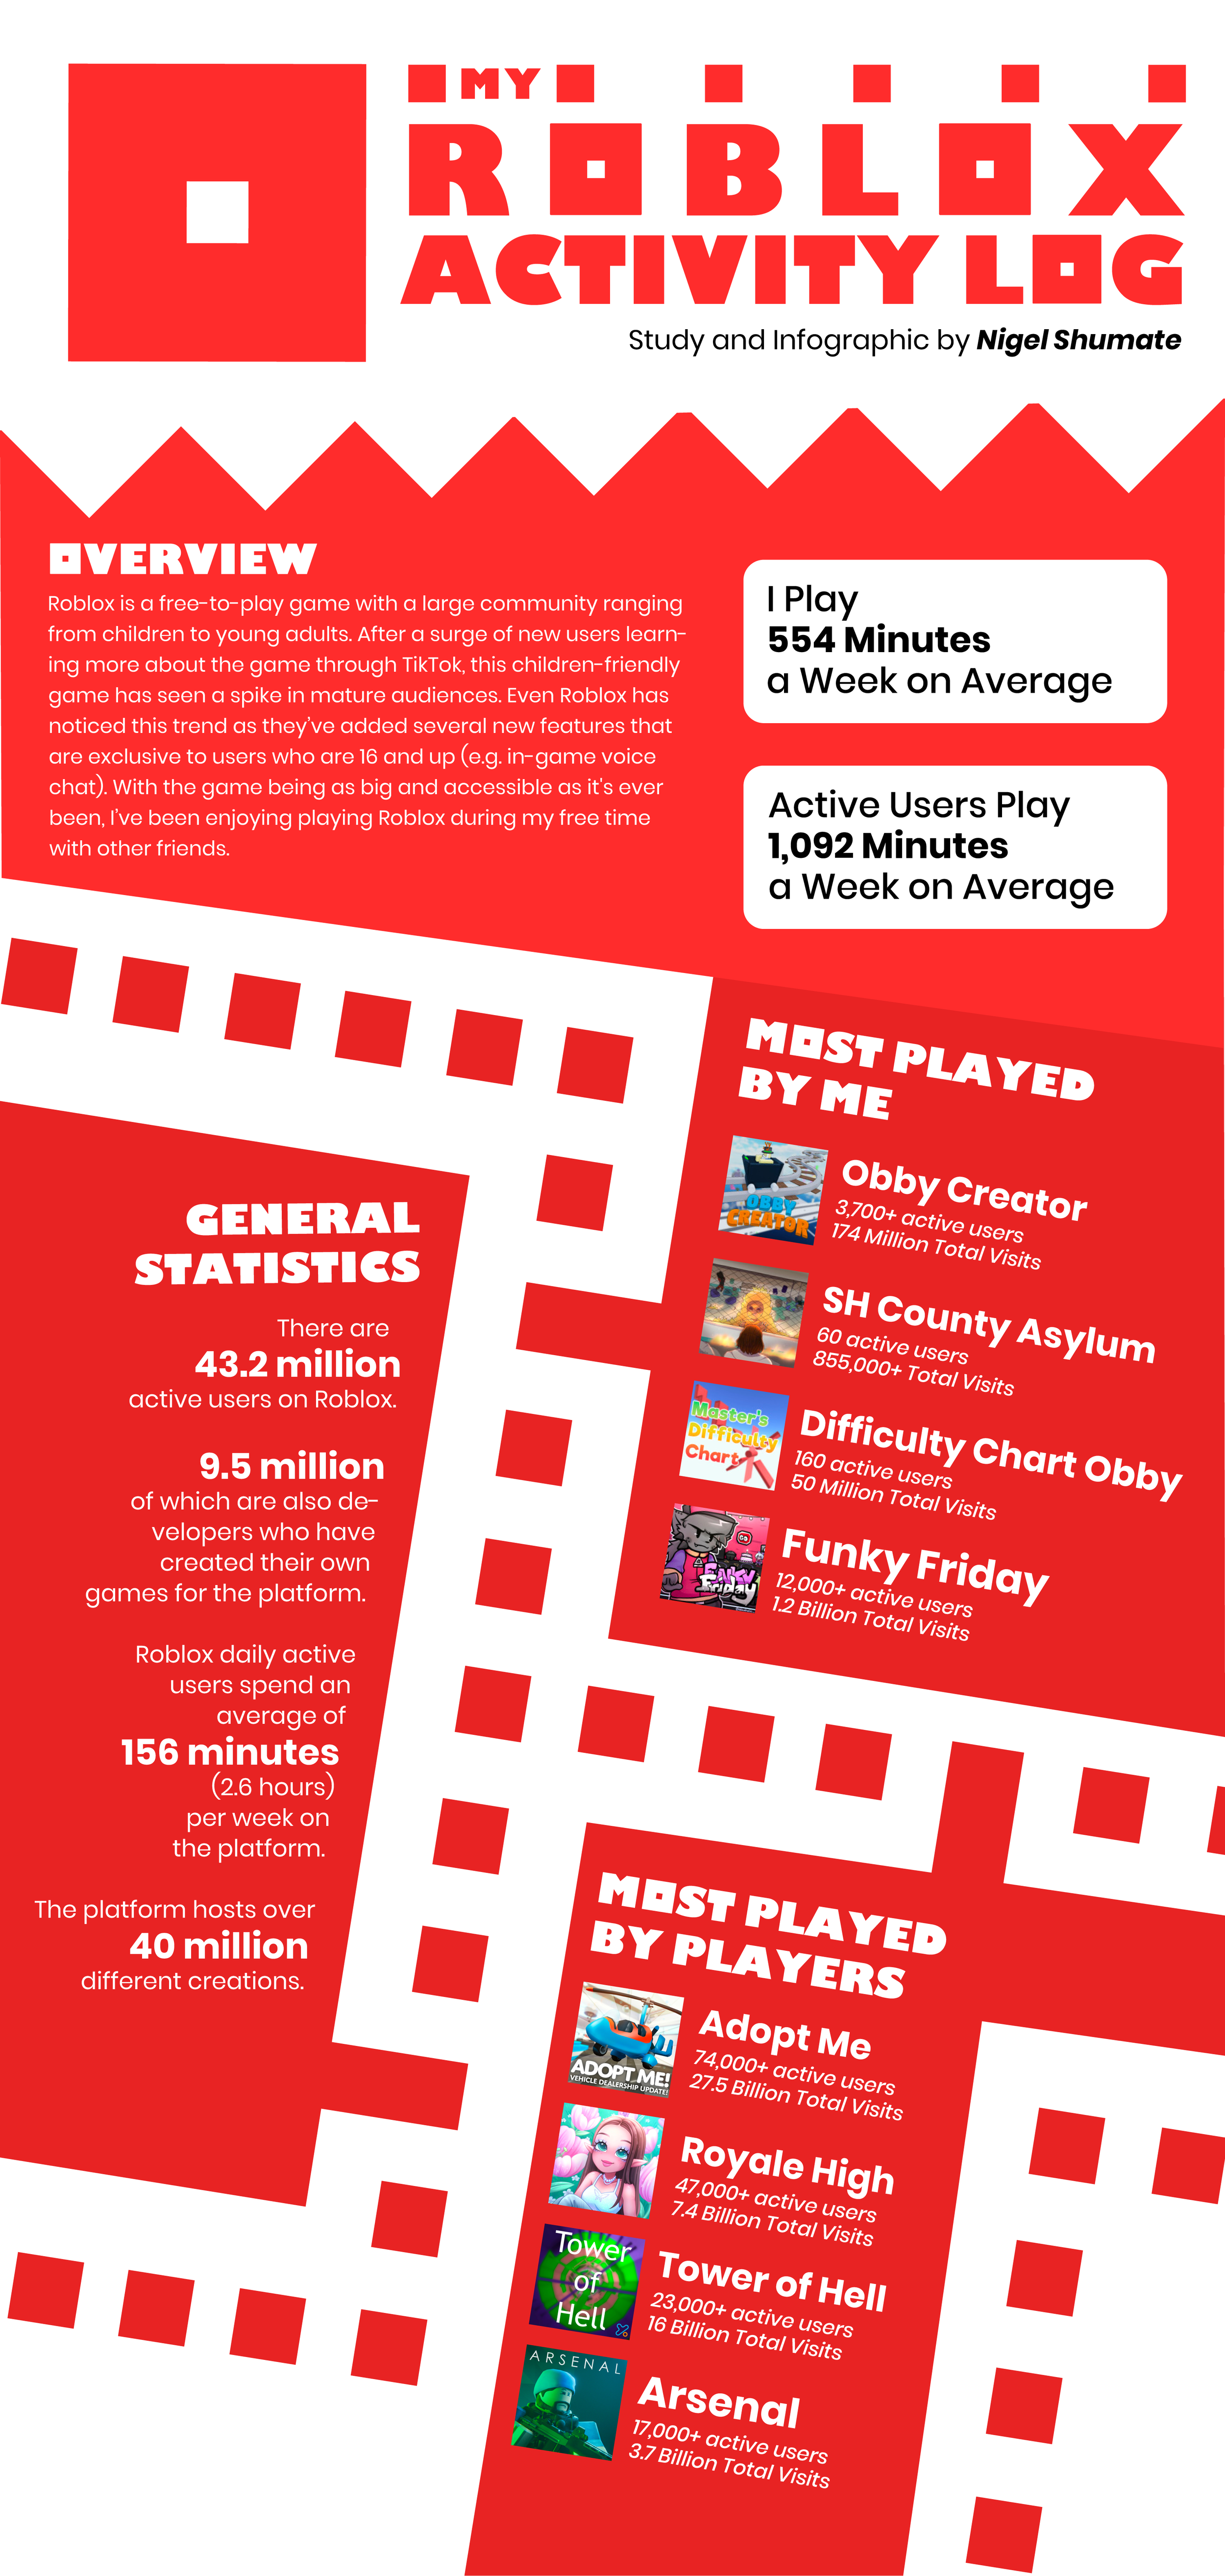
Through this digital poster, I’ve created a visual storyboard that focuses on many of the different statistics that will be showcased in the final product.
The Final product will start with the general overview on top, which will then transition into the statistics received from the gathered data. This will be accompanied by lists of popular games from both sets of data.
Ideation for Animations
I have a total of three different ideas of interactive/moving content that will be displayed in an Animated GIF format. The in-progress infographic along with the ideas can be seen below:
The Roblox logo is known for spinning in place as the game loads. I would make the logo zoom into place in the final animated lockup.
The basic overview will showcase the information textually, this will then fade out as graphs fade into the same place to help visualize the numbers for viewers.
The facts provided will be shown individually. As one fact fades away, another one fades in from the side.
Final Product
For my final animated infographic, I decided to focus on a 1x1 composition that can be used across a plethora of social media formats (e.g. Instagram, YouTube, etc).
The video follows the visual roadmap of the poster, the shapes of red help distinguish transitions into the four separate sections of the video. These sections include:
Intro
Overview
Numbers & Quantitative Data
General Statistics


